Onsei
Japanese pitch-accent practice tool
Stack: Python, Jupyter notebook, Voilà
See the project on GitHub
This project provides visual feedback to assess the pitch accent accuracy of a Japanese language learner, and help them practice by comparing their speech pattern with native speaker recordings. “Onsei” (音声) is a Japanese word meaning voice.
Problem
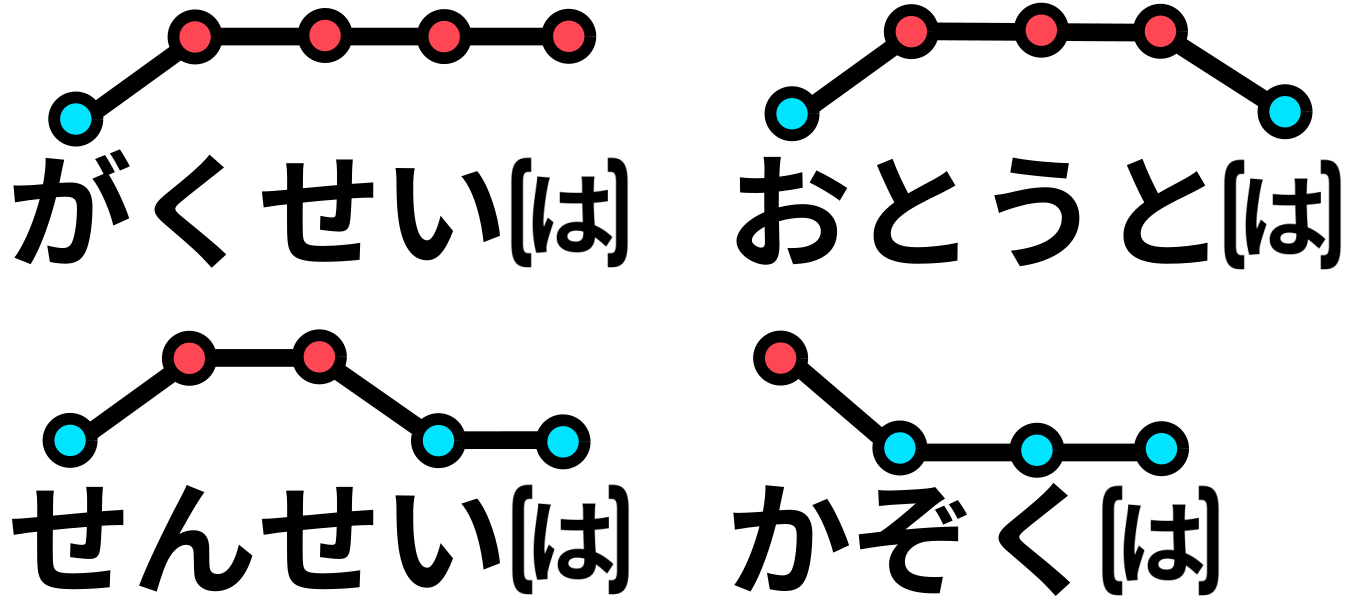
Japanese is a pitch accent-based language, which means that variations in the pitch (high or low) are applied to each phoneme. Here is an illustration of the pitch accent pattern for 4 words:
Although one can get by speaking Japanese without a proper pitch accent, it does make a big difference in how well natives will understand and perceive you. Think of someone speaking English with a strong accent, you might refrain from asking them to repeat themselves, or you might not understand them at all.
Foreign learners that don’t have a tonal mother tongue, such as English or French native speakers, will likely struggle to identify and reproduce the correct pitch patterns. This is like being colorblind and behind told to paint a picture of a sunset. Unfortunately, many Japanese teachers tell their students that Japanese has no accent at all, but acquiring a correct pitch accent does not come automatically with exposure to the language. In fact, many advanced Japanese learners still make pitch accent mistakes in most of their sentences!
Another layer of complexity comes at the sentence level: the pitch accent pattern of individual words is affected by how they are connected in a sentence. Therefore, knowing the pitch accent pattern of a word is not enough to correctly articulate it in a sentence.
Solution
My idea was to create a tool that would allow learners to practice their pitch accent at the sentence level with visual feedback and without a native partner or teacher.
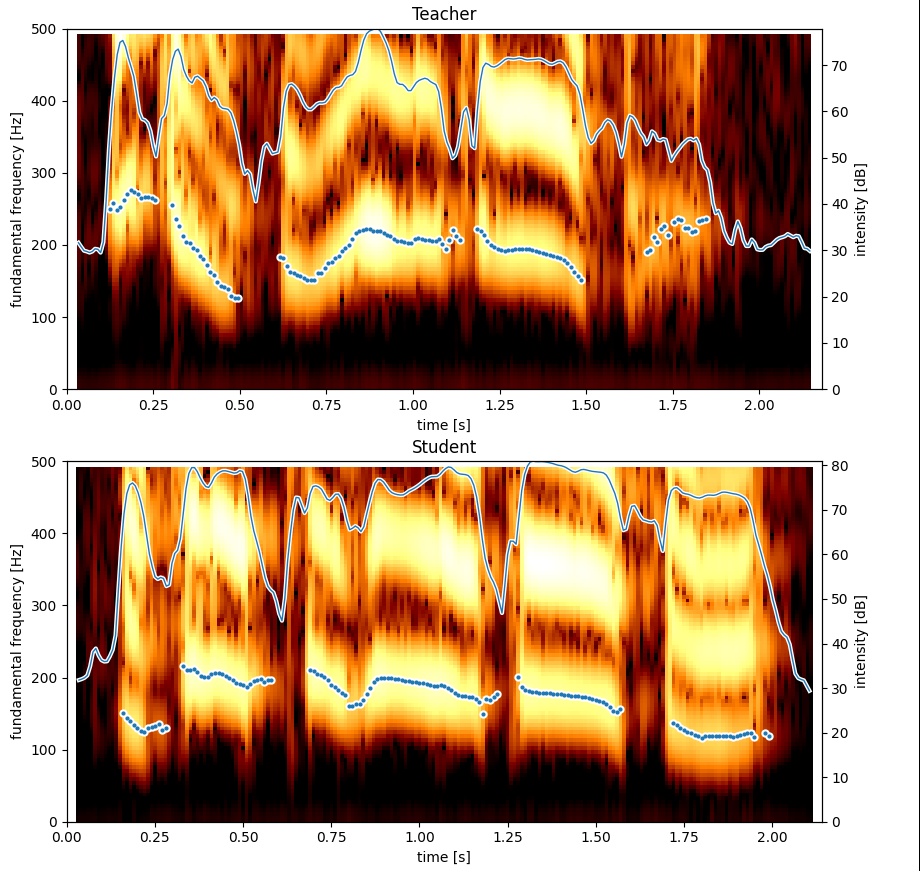
After reading a book on phonetics, I started experimenting with Praat, a speech analysis software used by researchers in that field. This helped me visualize the pitch accent of a recorded sentence, which is simply the fundamental frequency \(f_0\) of the signal (how high the tone is). From there, the next step was comparing the teacher or native speaker’s recording with the student or language learner’s recording.
The comparison required aligning the two sequences, as the timing and speed of each phoneme did not match exactly. I applied the dynamic time-warping algorithm to align the two recordings based on the volume. The assumption is that the student will have no problem mimicking the variations in loudness (which I call intensity), so it would be a good reference to perform the alignment with. This gave mixed results, so I switched to a more complex approach using phoneme segmentation and feeding DTW with step functions based on the phoneme boundaries (overkill, but that works!).
That combined with thresholds to cut out the silence and remove outlier data points, gave some encouraging first results.
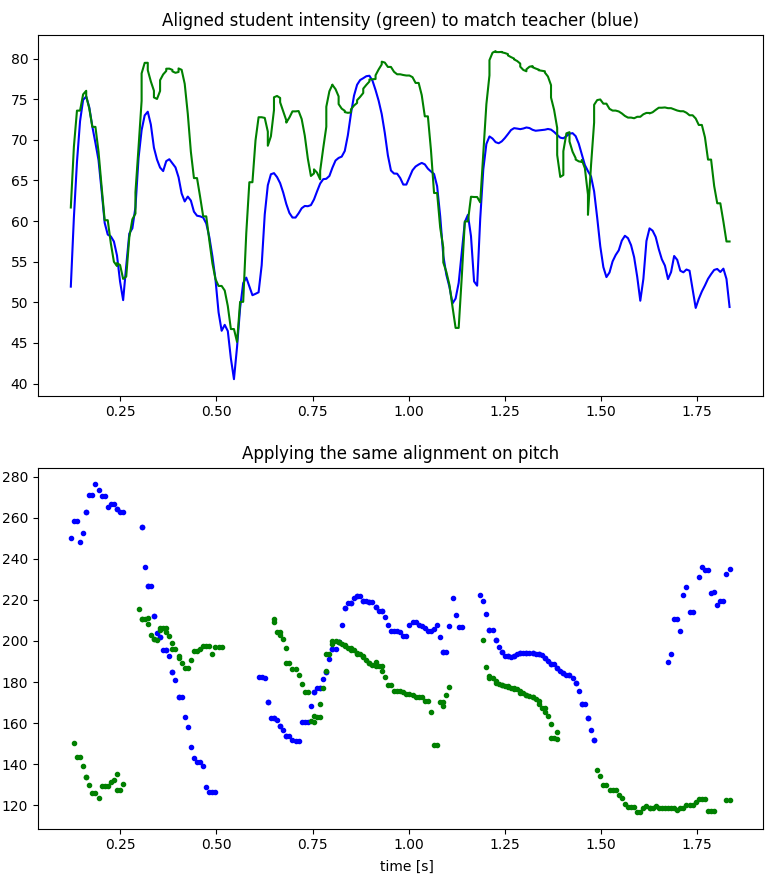
The last graph shows the fundamental frequency (in Hz) after alignment.
- Between 0 and 0.5s, you can see that the student’s pitch pattern (in green) is raising while the teacher’s pattern is dropping (in blue). That is a clear mistake!
- For the rest of the sentence, both match pretty well in terms of relative changes. The offset is due to the student’s voice being a bit lower than the teacher’s. Pitch accent is a relative variation in the speaker’s voice, so the student’s pattern is correct but the offset makes it harder to visualize (more on that in the Challenges section).
- The last part is not a student’s mistake, but the fundamental frequency being incorrectly detected. When the intensity is lower, which frequency is the fundamental one is less clear and it can create such inconsistencies.
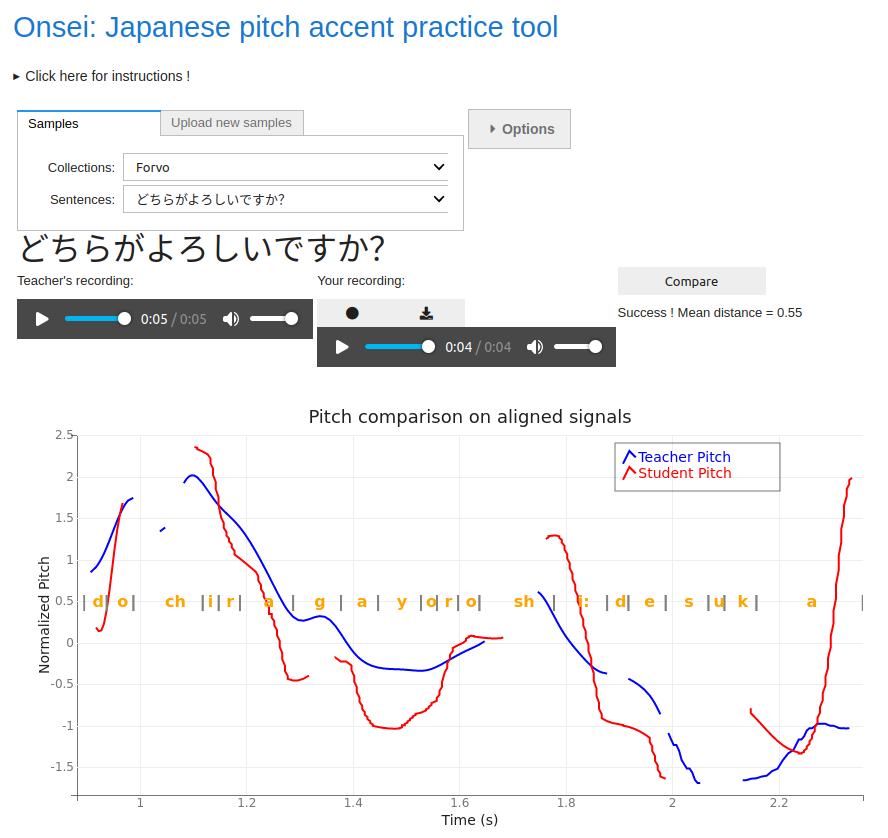
Using this system, I implemented an interface that allows the student to browse a collection of sentences (using data from Forvo), record their own utterance and compare it with the reference. I made the somewhat odd choice to use Jupyter notebook and Voilà to build the interface, which is a bit of a hack but it allowed me to stick to Python and quickly prototype something.
The interface can be spawned on demand using Binder (another good reason to use Jupyter notebooks), click here to play with it!
Finally, I develop an Anki plugin to integrate the tool into my learning process. Anki is a spaced repetition software that allows you to create flashcards and review them at regular intervals. I use it to learn Japanese vocabulary within example sentences. With the plugin, I can practice my pitch accent by recording myself directly inside Anki and comparing the recording with the audio example embedded in the flashcard.

Now, how well does it work?
To be honest, the system is far from perfect and it can fail horribly in some cases. This would require more work to make it robust enough. And while I initially considered building a product out of it, the reality is that it is completely overkill for most learners! I moved on to other projects, but I have a few ideas on how to make a much simpler version of it.
Challenges
While my background in NLP and ML helped for sure, I had to learn a lot about phonetics and signal processing. Fortunately, I got some help from a researcher in the field, Tim Mahrt, who provided guidance on phoneme segmentation. Thanks, Tim!
I spent quite some time debugging the transformations, in particular, to apply the DTW results to the fundamental frequency (which had a different sampling period). Aside from that, normalization of the fundamental frequency was also tricky. Offsetting everything by the mean frequency and normalizing by the variance was not enough, but I did not come up with anything much better. Some kind of time-sensitive normalization would probably work out.
Anki integration was a bit tricky because you don’t have any control over the Python environment that runs your plugin. In other words, if you have any dependencies, you have to shove them inside the plugin along with your code… I went around the issue by simply making API calls to a web service returning whichever graph I wanted to show.